

Displaying in-game data in a dynamic graph
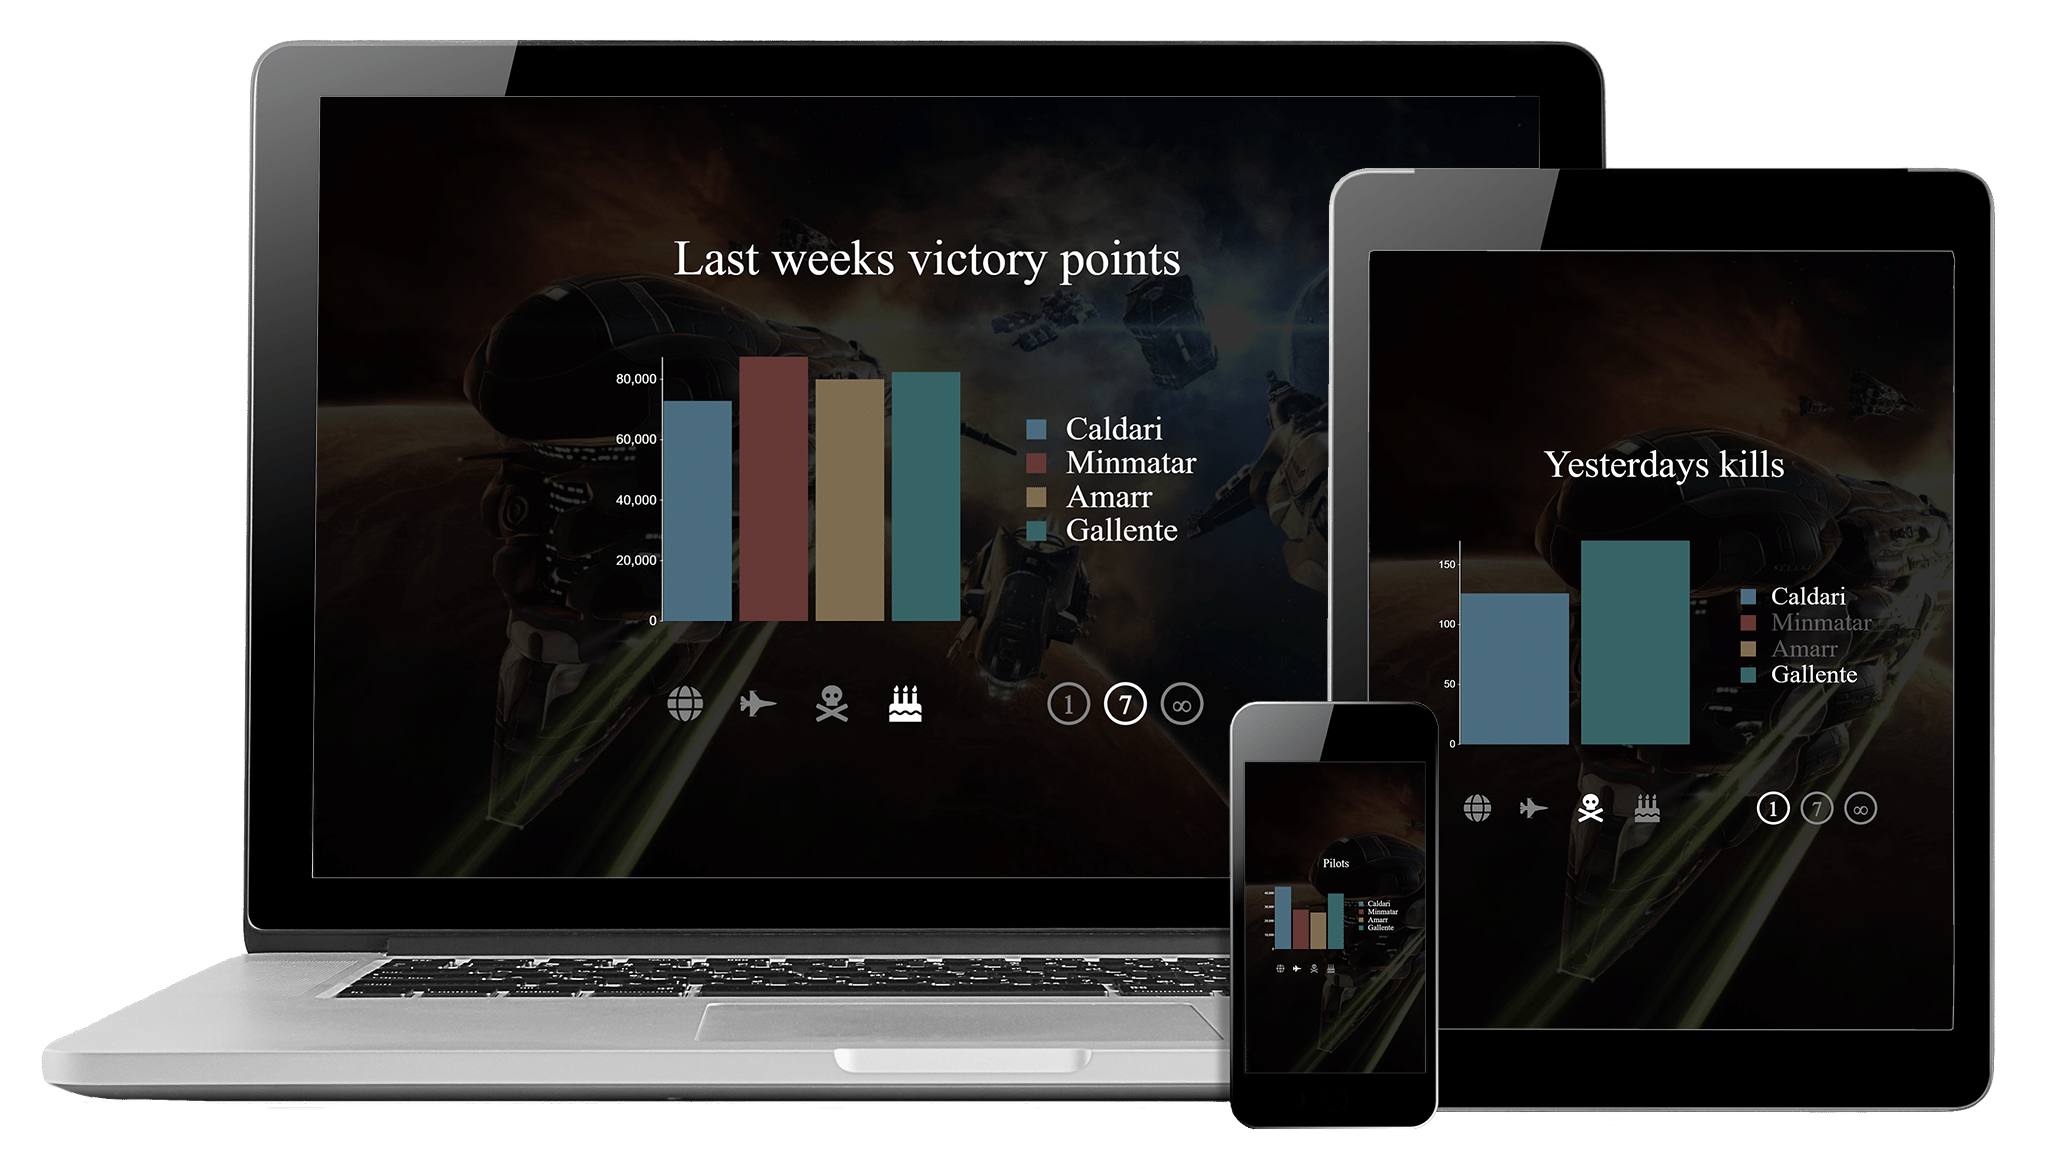
This website displays some in-game data visually. The website gets data online, processes it and turns it into a dynamic graph. Users can interact with the graph and display the data they are interested in.
Technology
This website has been built with angular and a library called d3.js. Angular is a tool to build webapplications. D3.js is a JavaScript library that makes it easier to create graphs. Combine the two and you have dynamic graphs.